What’s new in PowerBI Robots 3.2?

Table of Contents
- New recurrence options: Last day of the month and multiple times per hour
- Paginated Reports support
- New Power BI report delivery method: Webhook
- Choose between Summarized or Underlying data when exporting to Excel
- Use a DAX query when exporting a Power BI dataset to Excel
- Add color formatting to files exported to Excel
- New API methods
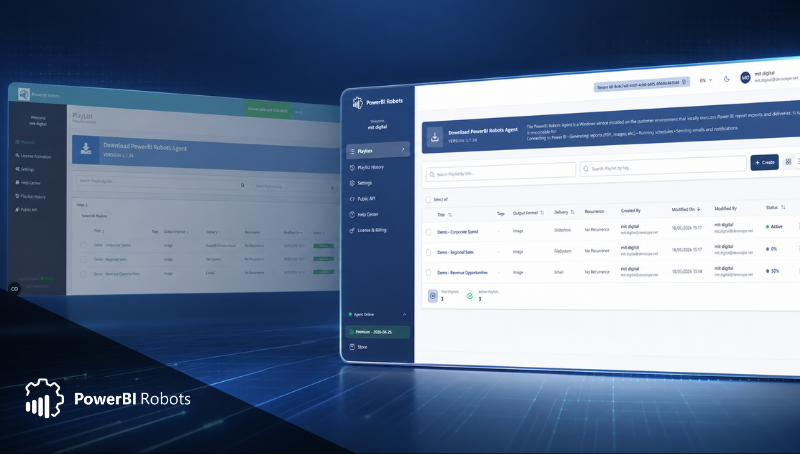
PowerBI Robots 3.2 is now available for download, and the latest version of the world’s most popular Power BI report automation tool is especially for power users. Exporting a Power BI report to Excel is heavily featured in this update, but we also have 9 new API methods and the ability to deliver Power BI reports to a webhook. If you aren’t a power user, worry not – our team also added the ability to add Paginated Reports to your PowerBI Robots playlist and two new recurrence options: sending your Power BI reports on the last day of the month and, finally, the much-requested ability to send Power BI reports multiple times per hour.
Let’s go over each of the new features in PowerBI Robots 3.2.
New recurrence options: Last day of the month and multiple times per hour
After much waiting, PowerBI Robots now supports the ability to send Power BI reports only during the last day of the month. Until now, sending reports on the last day required constant manual input from users since they could only choose specific days of the month. This meant that a report scheduled for the 31st would never be sent on months with 30 days, and the less we say about February, the better.
To select the last day of the month, in the General tab go to recurrence, and select Every Month. Delete the 1st in the days field, click the now empty field and scroll down to the "Last day of the month" option. You can then set the hour and minutes at which PowerBI Robots will send your reports in the last day of the month.
The second new recurring method is sending reports multiple times per hour. The option is available at every recurrence save for Minute and No Recurrence and you can select from a list of 5-minutes intervals. Keep in mind that if you select multiple times per day/week/month/year and add several options in the minutes field, PowerBI Robots will trigger for each of those intervals (as an example, selecting Every day at 00h00 and 12h00 in the hours field and 0m, 15m in the minutes field will send 4 playlists: 00h00, 00h15, 12h00 and 12h15).
Paginated Reports support
In addition to reports, dashboards, and single visuals, PowerBI Robots now supports Paginated Reports, optimized for printing Power BI reports that fit well on a page. Paginated Reports are created using Power BI Report Builder. You can add a Paginated Report to your PowerBI Robots playlist the same way you add any other visual: go to the Visuals tab, connect your Power BI account and select the Paginated Report from your workspace.
New Power BI report delivery method: Webhook
A webhook (aka web callback or HTTP push API) is a method for an app to provide other apps with real-time information. Unlike an API, a webhook delivers data immediately.
PowerBI Robots now supports webhooks as a delivery method. To send your playlist to a webhook, select webhook under Deliver To in the General tab. Then, in the Recipients tab, you’ll find the Webhook URL field, as well as optional HTTP Headers fields.
Choose between Summarized or Underlying data when exporting to Excel
When you select single or multiple Excel files as your output format, you can now choose to display either Summarized or Underlying data:
- Summarized – if you want to export data for what you currently see in the visual.
- Underlying – if you want to export data for what you see in the visual plus additional data from the underlying dataset.
Use a DAX query when exporting a Power BI dataset to Excel
Advanced users can now use DAX queries in the datasets they export to Excel using PowerBI Robots. To do this, select Single or Multiple Dataset Excel as your output format in the General tab. Then, go to the visuals tab, connect your Power BI account a select a dataset from your workspace. The DAX Query field is available under Advanced Settings.
Add color formatting to files exported to Excel
The last new feature concerning exporting to Excel allows you to style your sheets directly from PowerBI Robots’ General tab. Start by selecting Single or Multiple Excels as your output format. Then, there will be a new option called Excel Style under Rendering Settings. Besides setting the auto filter on rows, you can set the fill colors of the header, odd and even rows, and their respective font and border color. A preview sample is available while tinkering with these settings.
New API methods
Finally, our team added several new methods to the public API that allow developers to do more with PowerBI Robots:
-
- /playlist.delete
- /playlist.list
- /playlist.info
- /playlist.rename
- /playlist.setRecurrency
- /playlist.execute
- /playlist.history
- /playlist.create
- /playlist.edit
To upgrade to PowerBI Robots 3.2, log into your PowerBI Robots account and click the blue banner in the Playlists tab or click here to download the latest version of the desktop agent. If you find any issue using PowerBI Robots 3.2, get in touch with our team at support@devscope.net.
Share this post: