PowerBI Portal Just Got Smarter. Here’s What Changed
Table of Contents
- 1. Portal AI: ask questions about your Power BI data, in plain language
- What users can ask
- The security difference that matters
- 2. A unified experience: front-office, back-office and a redesigned interface
- Why this matters beyond convenience
- What changed visually
- 3. New guided onboarding: live in 5 steps, no IT required
- The 5 steps
- 4. Why this matters for Power BI delivery at scale
- The licensing problem
- The security problem
- The adoption problem
- 5. Try it today
Three features. One product update. And a fundamentally different way to think about what a PowerBI Portal can do, for your users, your data governance, and your licensing bill.
Power BI is one of the most widely deployed analytics platforms in the world. But between what it can do and what most organisations actually get from it, there has always been a gap. Reports that never reach the right people. Access that breaks when roles change. AI tools that ignore the security model you spent months building.
Today, PowerBI Portal closes three of those gaps at once. Here is what’s new, what it means in practice, and why the timing matters.
1. Portal AI: ask questions about your Power BI data, in plain language
The most significant addition to PowerBI Portal is a built-in conversational AI agent, Portal AI, that lets any user ask natural-language questions about the data in their active report.
This is not a generic chatbot. Portal AI is connected directly to your Power BI dataset. Ask it something and it goes to your data, not to the internet. Ask it something you don’t have permission to see and it won’t answer, because Row-Level Security is enforced at every query, by design.
What users can ask
The range of questions Portal AI handles covers most of what a data analyst would look for in a report:
- Performance comparisons: "Which product category had the highest margin last quarter?"
- Trend analysis: "Show me monthly revenue for the past 12 months."
- Rankings: "Who are the top 10 clients by revenue this year?"
- Variance breakdowns: "What drove the revenue drop in Q3?"
- Period comparisons: "How does this quarter compare to the same quarter last year?"
- Follow-up questions and drill-downs in a single conversation.
Questions can be asked in English, Portuguese, French, Spanish, Chinese and German.
The security difference that matters
Most analytics AI tools operate on top of a security layer. Portal AI operates inside it. Every response is generated within the user’s existing Row-Level Security context. If a user isn’t authorised to see data, Portal AI won’t return it, regardless of how the question is phrased.
Every query is logged. Every answer is traceable. Full audit trail, no exceptions.
2. A unified experience: front-office, back-office and a redesigned interface
The first PowerBI Portal AI to enforce Row-Level Security natively at every query. By design.
If you have managed a PowerBI Portal before, you know the friction. The admin interface and the user interface have always felt like two different products, because, in most setups, they were.
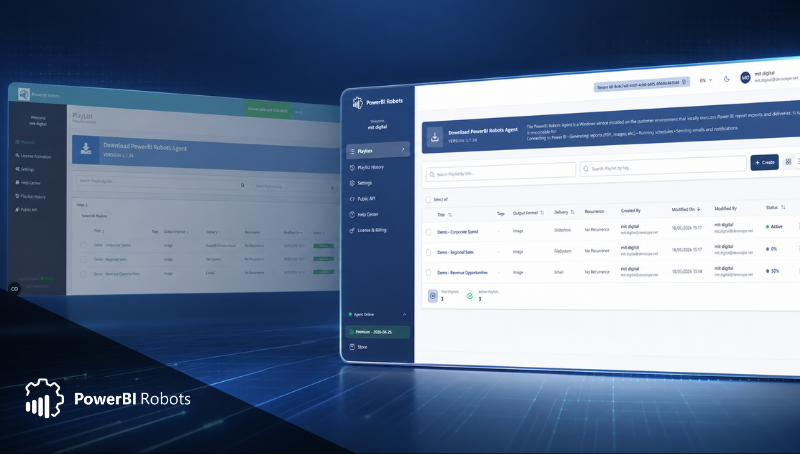
The new version of PowerBI Portal brings front-office and back-office into a single, coherent experience. Administrators configure and manage from the same environment where users consume reports. No handoffs. No context switching. No moment where the admin experience and the user experience diverge.
Why this matters beyond convenience
When the administration experience is separate from the user experience, small misalignments compound. A permission that looks correct in the admin panel behaves differently for the end user. A report that appears correctly configured fails to render. Unifying the two surfaces eliminates an entire category of errors before they happen.
Administrators now see what users see. Configuration changes reflect immediately.
What changed visually
Beyond the unified architecture, PowerBI Portal ships with a refined interface designed around the way users actually navigate and consume analytics. Cleaner layouts, improved information hierarchy and a visual language that makes reports easier to read and faster to act on.
The goal was not to redesign for the sake of it. Every change responds to a specific friction point observed in how real users interact with the portal. The result is a product that feels more complete and more professional, without requiring any configuration from the administrator.
- Improved navigation structure with clearer report organisation
- Consistent visual language across front-office and back-office views
- Better use of space on report pages, giving data more room to breathe
- Refined onboarding screens that guide new administrators step by step
3. New guided onboarding: live in 5 steps, no IT required
One of the most common reasons organisations delay deploying a Power BI portal is setup complexity. Connecting a workspace, provisioning users, configuring Row-Level Security, testing access — each step introduces risk and requires someone technical.
The new PowerBI Portal onboarding reduces the entire process to five guided steps that most administrators complete in under 30 minutes. No developer. No IT ticket. No project.
The 5 steps
- Connect your workspace — link your Power BI or Microsoft Fabric workspace in seconds.
- Add reports — select which reports appear in the portal. No re-publishing required.
- Provision users — add users individually or sync via Active Directory.
- Configure permissions — assign Row-Level Security roles and access levels per user or group.
- Go live — test with a built-in preview login. When everything looks right, launch.
4. Why this matters for Power BI delivery at scale
Each of the three features above solves a specific, measurable problem. Together, they change the answer to a question that most data teams have been asking for years: how do we get Power BI to actually work for everyone who needs it?
The licensing problem
Power BI Pro costs around €9.40 per user per month. For a team of 500 external report viewers, that’s roughly €56,000 per year, for read-only access. PowerBI Portal replaces per-user licensing with a single capacity model. Based on customer experience, organisations typically reduce Power BI licensing costs by up to 70%. The built-in ROI Simulator calculates your specific number in under two minutes.
The security problem
Row-Level Security in Power BI is powerful when it’s correctly configured and consistently enforced. When it isn’t, the consequences range from data leaks to compliance failures. Portal AI is the first analytics AI to enforce RLS at query level, closing the gap between how security is configured and how AI actually responds to users.
The adoption problem
The most common reason Power BI deployments fail to reach their potential isn’t technical, it’s friction. Reports that require an IT ticket to access. Portals that take weeks to configure. AI tools that feel like a separate product. The new onboarding and unified experience are built specifically to reduce that friction to near zero.
PowerBI Portal is powered by Microsoft Power BI Embedded and Microsoft Fabric, the official, Microsoft-approved way to deliver Power BI analytics at scale. Your data never leaves your Power BI environment. Works with any Fabric or Power BI Embedded capacity, including F2 SKU.
5. Try it today
All three features are available now on PowerBI Portal. Portal AI is available on the Enterprise plan. The unified experience and new onboarding are available across all plans.

Share this post: