




PowerBI Portal 101: How to Deliver Power BI Analytics the Right Way
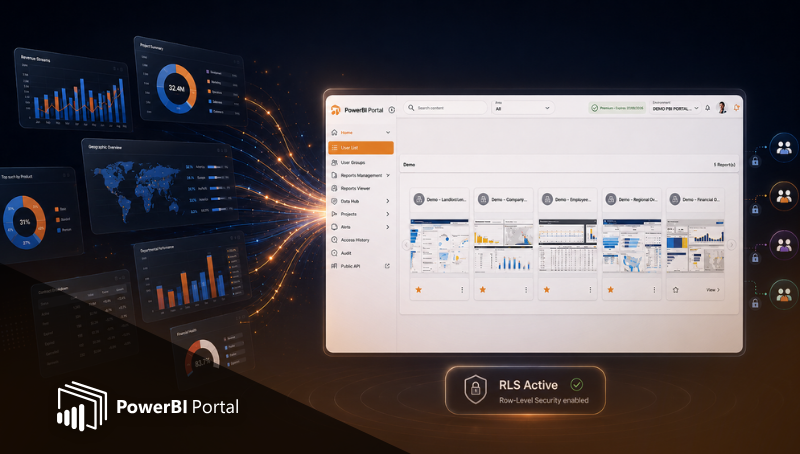
Delivering analytics to the right people has always been harder than building dashboards. Most organizations master the technical side of Power BI quickly: datasets, models, visuals, and performance tuning. The real challenge appears one step later, when it's time to distribute insights to a broader audience. PowerBI Portal exists precisely to solve this problem.
This guide introduces PowerBI Portal from a practical, real-world perspective — what it is, why it exists, and how it changes the way organizations distribute Power BI analytics internally and externally — and then walks you through setting it up step by step. If you already use Power BI and have reached the limits of native sharing, this is the foundation you need.
The Real Problem Power BI Was Never Designed to Solve
Power BI is exceptional at analytics creation. It is not a distribution platform. Native Power BI sharing assumes internal users, stable identities, license-based access, and collaboration rather than delivery. These assumptions break the moment analytics need to be shared with clients or partners, rolled out to large audiences, embedded into products or portals, or made available without licensing friction.
Most organizations feel this pain gradually. At first it's manageable. Then analytics adoption grows, and sharing becomes the bottleneck. PowerBI Portal is designed to remove that bottleneck.
What Is PowerBI Portal?
PowerBI Portal is a secure, web-based analytics portal built to distribute Power BI content at scale. Instead of giving users access to the Power BI Service, it lets organizations embed Power BI reports and dashboards, control access through a dedicated portal, deliver analytics to unlimited users, and keep security and governance intact. From the end user's point of view, it feels like a standalone analytics application; from the organization's point of view, it stays tightly connected to Power BI.
How PowerBI Portal Fits into Your Architecture
PowerBI Portal does not replace Power BI — it sits on top of it. A typical flow: Power BI datasets and reports remain in your tenant, Row-Level Security is defined in the model, reports are embedded into the portal, users authenticate in the portal rather than in Power BI, and access is controlled centrally. This separation keeps analytics governance where it belongs (in Power BI) while fixing the distribution layer that Power BI does not provide.
One Portal, Many Use Cases
PowerBI Portal is designed for organizations that distribute analytics rather than collaborate on them. Typical use cases include client-facing dashboards, partner and supplier reporting, executive or board portals, multi-department analytics hubs, and white-label or productized analytics. The unifying theme is always the same: people need access to insights, not to Power BI itself.
Unlimited Users Without Per-User Licenses
Traditional Power BI sharing ties cost to headcount — every new viewer implies licensing discussions, approvals, and friction, which discourages wide distribution. PowerBI Portal uses a capacity-based approach: compute resources are centralized, viewer count does not change the cost structure, and analytics scale with usage rather than accounts. This makes analytics something you can distribute confidently, without worrying about who is allowed to see information from a licensing perspective.
Security That Scales Instead of Breaking
External analytics often fail not because of weak security, but because security becomes too complex to manage. PowerBI Portal approaches it from two angles: portal-level access control and Power BI Row-Level Security. Users only see what they are allowed to see, consistently across reports, dashboards, drill-downs, and AI-driven queries. Because security rules live in the dataset, they survive growth, reorganization, and new audiences.
A User Experience Designed for Consumption
The Power BI Service interface is built for analysts; PowerBI Portal is built for consumers. There are no workspaces, no irrelevant menus, no technical clutter, and no confusion about where content lives. Users log in, select what matters to them, and consume insights — simplicity that directly improves adoption and reduces support overhead. For administrators, the portal introduces a single place to manage distribution: one access model instead of scattered permissions, central visibility over users and content, and a clean separation between internal BI and external delivery.
Analytics as a Product, Not a File Share
Perhaps the most important shift PowerBI Portal enables is conceptual. Instead of treating analytics as something you share, you begin treating it as something you deliver. Analytics stops being a by-product of reporting and becomes a first-class product offered to users — changing how teams think about ownership, quality, reliability, and experience. Organizations typically reach PowerBI Portal when they recognise patterns like "we need to share analytics with more people", "licenses are blocking adoption", "clients don't understand the Power BI interface", or "governance is becoming fragile". At that point, it's not a nice addition — it's the missing layer.
Getting Started: A Step-by-Step Guide
Now that the concept is clear, here's how to actually set up and run PowerBI Portal, from requirements through to the end-user experience.
Who Should Use PowerBI Portal?
PowerBI Portal is a useful tool for organizations that share large amounts of reports and dashboards daily, need to make part of their data available to clients or business partners, must control how reports are shared with people outside their organization, or want to lower the Azure hosting costs associated with their report-sharing activity.
Requirements
Unlike our previous products, PowerBI Portal requires the subscription of additional Microsoft services:
- At least 1 Power BI Pro license — some functionalities are unlocked by Pro, such as creating App Workspaces and peer-to-peer sharing.
- A Power BI Embedded subscription — Embedded is the engine powering the portal: it's what lets it embed reports and dashboards, and set the timer for the capacity service that reduces your Azure bill.
Setting Up PowerBI Portal
PowerBI Portal uses several services that must be enabled before use. That one-time process is covered in 5 simple steps in the first tab of the Help Center, "Configure Access to PowerBI Portal". After completing it, go to the Settings tab to configure your organization's portal, where you'll find three tabs:
Power BI Access
Fill in your organization's Tenant Authority — the ID of its Azure Active Directory tenant or an associated domain. If you created your own app during the access configuration, also fill in your app's Client ID and Client Secret so PowerBI Portal can access it.
Power BI Embedded
Fill in the information from your Azure Portal: subscription ID, Resource Group Name, and Dedicated Capacity. Again, if you created your own app, fill in its Client ID and Client Secret. Finally, set your Power BI Embedded timeout — the number of minutes of no usage after which PowerBI Portal automatically pauses the Embedded Capacity Service. For example, set to 20, the service stops after roughly 20 minutes of inactivity. By default it's 0, meaning Embedded never stops to save resources.
Appearance
Customize your portal: switch between dark and light themes, set a welcome message, change the background, upload your logo to the top bar, and change the frontoffice primary color. When you're done, click Save in the top right corner.
Adding a New User
From the navigation menu, click Users to access the Users list, where you manage each user's role, what they access, and their unique access code. You can add users individually or import them in bulk via Excel.
To add a user individually, click Add New, insert the user's email, and pick their role:
- Frontoffice — access only to your organization's portal frontoffice.
- Backoffice — can add new users (front and backoffice), new reports, and manage the access list; can reach the frontoffice from the navigation menu.
- Master — full access including the settings menu, and can add new Master users.
Then generate a random access code or create one with up to 20 characters. PowerBI Portal supports access via a Microsoft Account: if the email is associated with one, the user can sign in with their access code or the "Sign in with Microsoft" button. Click Add User, repeat as needed, and click Save.
To add users in bulk, click Import via Excel, download the template, fill in the emails, roles, and access codes, then upload it back and click Save. All users added are notified by email.
Adding a New Report
Click Reports in the navigation menu, then Add New. Two fields are mandatory: a unique Name of your choice, and the report's URL in Power BI Online. The optional fields let you fine-tune the experience:
- Area — reports sharing the same area name are grouped together in the frontoffice for ease of access.
- Row Level Roles — if you use roles defined in Power BI Desktop to restrict access, enter the exact role name here.
- Row Level User — enter the email of a user you want to restrict access to for this report.
- Order — sets the order in which reports in the same Area appear in the frontoffice.
- Filter — for advanced users only; paste a JSON filter to apply to the report.
There are also checkboxes that determine what frontoffice users see: Show Filters Panel (toggles Power BI's side panel), Show Navigation Pane (toggles the tabs at the bottom of a report), and Active (toggle off to hide the report in the frontoffice). You can click the report preview image to replace it. When you're done, click Add Report and Save.
Associating a Report to a User
With your users and reports in place, pair them up. Click Access List in the navigation menu, then Add New. Select the user or group of users in the first field, and the reports to give them access to in the second. You can give many people access to the same report, or grant one person access to several reports. Click Add Association, repeat as needed, and click Save.
Accessing the Frontoffice
All users added through the backoffice have access to a frontoffice where their associated reports are available. They sign in with their unique access code, or with the "Sign in with Microsoft" button if that account matches an email entered in the backoffice. Once in, users see all reports associated with their account and can view or edit them according to their permissions. In the top left corner, they can switch between Areas if available.
Final Thoughts
PowerBI Portal is not about changing how you build analytics — it's about changing how you distribute them. By separating creation from delivery, it lets organizations scale analytics without friction, maintain security without complexity, deliver insights with confidence, and control cost without sacrificing experience. If Power BI is your analytics engine, PowerBI Portal is how those analytics finally reach their full audience.
👉 Book a demo today to see how PowerBI Portal helps you get the most out of Power BI capacities.

Share this post: