Driving Sales with Data: Building a Powerful Power BI Dashboard for Your Sales Team

Are you looking to improve your team’s results with data-driven sales? A well-designed Power BI dashboard is one of the most powerful tools at your disposal. Far more than a simple sales report, an interactive dashboard provides the crucial sales analytics needed to make smarter decisions, faster.
This Power BI sales dashboard tutorial will guide you through everything you need to know. We’ll cover how to build a sales dashboard in Power BI from the ground up, explore powerful Power BI sales dashboard examples, and show you how to effectively track sales performance to transform your entire sales process.
Why Power BI for Your Sales Dashboard?
Many teams are still creating their sales dashboard in Excel vs Power BI. While Excel is familiar, it lacks the dynamic capabilities needed for modern sales data visualization. Power BI allows you to create a truly interactive sales report, letting users click, filter, and drill down into the data.
Furthermore, with a mobile sales dashboard Power BI automatically optimizes for phones and tablets, your team can access critical insights on the go. It’s a significant step up for any sales manager dashboard strategy.
Designing a Sales KPI Dashboard: Key Metrics to Track
The foundation of a great sales performance dashboard is choosing the right KPIs. Here are the essentials for a complete view, covering everything from high-level performance to your sales funnel.
Sales Performance KPIs: Track your core results like Total Revenue, Win Rate, and Average Deal Size. This is the heart of any sales KPI dashboard.
Sales Pipeline & Funnel KPIs: A robust sales pipeline dashboard is critical. Monitor metrics like new leads, conversion rates by stage, and sales cycle length. This is often visualized as a sales funnel dashboard to quickly identify bottlenecks.
Forecasting KPIs: While complex, a basic sales forecast dashboard can be built by tracking your weighted pipeline value and historical conversion rates to predict future revenue.
How to Create a Sales Dashboard: A Step-by-Step Guide
Ready to get practical? Here’s how you can create a sales report in Power BI.
Step 1: Connect Sales Data to Power BI
The first step is to bring in your data. Power BI has native connectors for most data sources. This is particularly easy if you need to create a Power BI Salesforce dashboard or a Power BI Dynamics 365 sales dashboard, as the integration is seamless. You can also connect to SQL databases, Excel files, and more.
Step 2: Build Your Sales Data Visualizations
Once your data is connected, you can start building your visuals. Drag and drop your data fields onto the canvas to create charts and graphs. For instance, use a column chart for sales by rep and a map for sales by territory.
Step 3: Assemble Your Interactive Sales Report
Arrange your visuals into a clean, single-page layout. Add slicers and filters for interactivity, allowing users to explore the data. This process turns a static report into a powerful analytical tool.
Power BI Sales Dashboard Examples
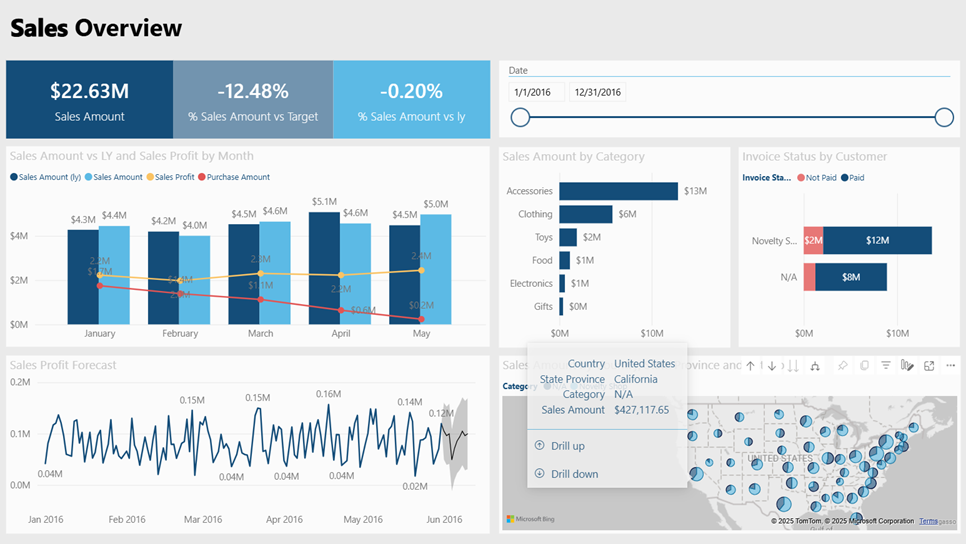
To give you some inspiration, here are two common examples that can serve as a sales dashboard template in Power BI. The B2B Sales Manager Dashboard: This high-level dashboard provides a complete overview of sales team performance tracking. It features aggregate KPIs, team leaderboards, and regional performance maps.

Taking Your Sales Reporting to the Next Level
Once your initial sales performance dashboard is live, you can implement advanced techniques to further improve sales performance with data. Here are four strategies that, na nossa experiência como consultores, separam as equipas de vendas boas das excecionais.
1. Go Beyond Tables with Visual Performance Tracking
Most teams begin their sales team performance tracking in Power BI using tables with slicers for each sales rep. This is a functional starting point.
However, a best practice we’ve observed in high-growth teams is to make performance tracking as visual and motivational as possible. From an expert’s point of view, the goal is to reduce friction and create an "at-a-glance" understanding of who is leading and who needs support. This often means moving towards dedicated ‘scorecard’ visualizations. Implementing this can be done with custom development or by using specialized platforms. Our Power BI Scorecards, for instance, was designed around this very principle of visual motivation.
2. Introduce Gamification to Drive Results
Use the data from your sales KPI dashboard to create friendly competitions. This is a highly effective strategy that requires no extra software. You can set monthly challenges—like a "Top Closer Award" for the highest win rate—and display the leader on the main dashboard. This makes engaging with sales data fun and reinforces a culture of high performance.
3. Implement Advanced Report Automation
Power BI’s native "Subscriptions" feature is useful for scheduling internal report delivery. It’s a solid first step in automation.
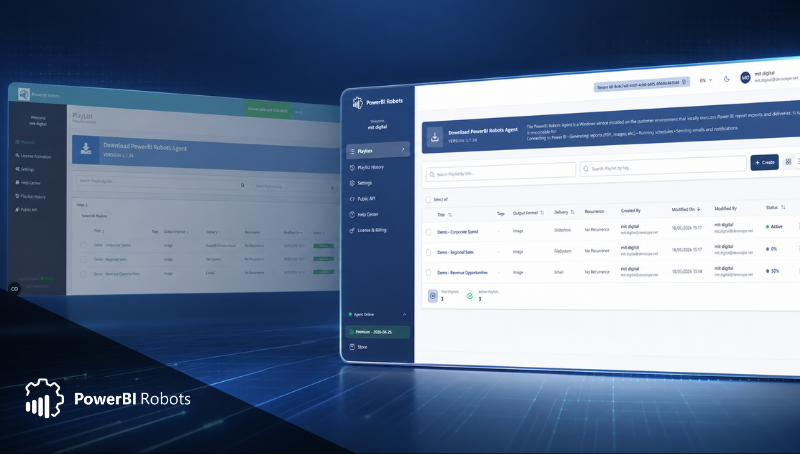
That said, experts in business intelligence often advise implementing a more robust automation engine for scenarios with greater complexity. For example, if you need to send a daily sales report to external partners (who don’t have a Power BI license) or deliver just a single, critical KPI to an executive’s phone. There are various ways to achieve this, including using Power Automate or dedicated tools. Power BI Robots, for example, is a solution that focuses exclusively on this type of advanced, flexible report distribution.
4. Consolidate Assets into a Centralized Sales Hub
Organizing reports into Power BI Apps is a good standard practice for content management.
From a strategic standpoint, however, a best practice for mature organizations is to create a single, branded "Sales Hub". This turns your analytics into a true information product for your team. This hub should not only host your interactive sales report but also other essential resources like price lists, battle cards, and training materials. This can be a significant custom project, but platforms exist to streamline it. This is the reason we developed Power BI Portal—to give companies a way to implement this best practice without a massive internal development effort.
Ready to Embrace Data-Driven Sales?
You now have a complete blueprint to build a sales dashboard in Power BI. Moving from static reports to an interactive sales analytics platform will empower your team to make smarter, data-backed decisions and ultimately drive revenue.
Ready to build your sales engine? Contact our experts for a consultation, or explore our Power BI Tiles Suite to see how you can take your reporting to the next level.
Share this post: