


Embedded Analytics Costs in the Real World: What People Usually Miss
When teams start planning an embedded analytics initiative, cost estimation is often the first conversation and the one that creates the most anxiety. Spreadsheets get built, scenarios get debated, and assumptions get locked in early.
And yet, many of these cost models miss the factors that actually matter once the solution is live.
Embedded analytics costs are rarely driven by what people initially expect. Over time, teams realize that user count, license lists, and static pricing assumptions explain very little about real-world spend. What really drives costs is how analytics are used in practice.
This article breaks down what organizations usually miss when estimating embedded analytics costs and how to think about cost realistically before going to production.
The Most Common Mistake: Treating Embedded Like Per‑User BI
A surprising number of embedded analytics cost models start with an internal BI mindset:
- How many users will we have?
- How many reports will each user access?
- What is the equivalent per-user license cost?
This mental model is understandable but wrong.
Embedded analytics does not behave like per-user licensing. Costs are not driven by how many people have access, but by how the system is being used under load.
Treating embedded analytics as "Power BI Pro, but for externals" almost always leads to incorrect estimates.
Why User Count Is a Poor Cost Predictor
In embedded analytics, user count is one of the least reliable indicators of cost.
Consider two scenarios:
- Scenario A: 1,000 registered users who log in a few times per month
- Scenario B: 80 users who access dashboards constantly during business hours
From a capacity perspective, Scenario B is often more expensive.
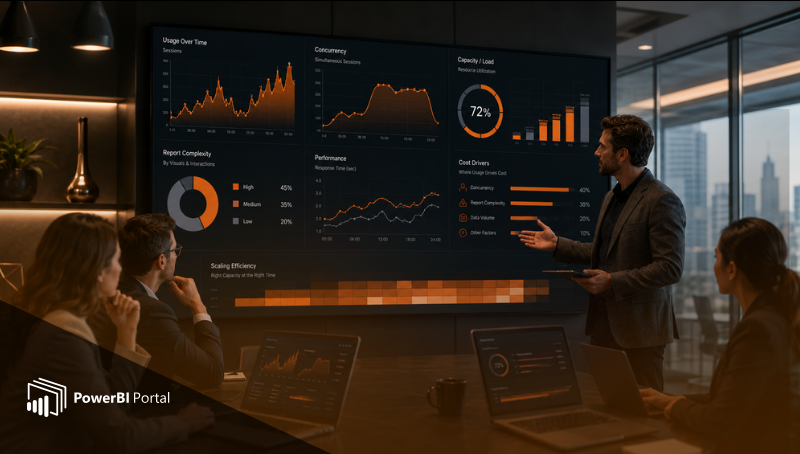
What matters is not how many people can access reports, but how many people are interacting with them at the same time, and how demanding those interactions are.
This is why teams that model costs purely on headcount often get surprised after go‑live.
The Real Cost Drivers (in Practice)
Let's look at the factors that actually shape embedded analytics costs in production.
1. Concurrency, Not Total Users
Concurrency is the single biggest driver of cost.
- How many users are active at the same time?
- When do usage peaks occur?
- Are users mostly reading, interacting, or refreshing frequently?
Ten users hitting the same report simultaneously can generate more load than a hundred users spread across a day.
Most early estimates assume "average usage." Real systems are shaped by peaks.
2. Report Complexity Has a Hidden Price
Not all reports are created equal.
Cost is influenced by:
- Number of visuals per page
- Use of complex DAX measures
- Large datasets or high-cardinality columns
- Multiple slicers triggering recalculations
Two portals with identical user numbers can have dramatically different costs depending on how reports are designed.
This is why embedded cost optimization is as much about report engineering as it is about infrastructure.
3. Usage Patterns Change After Launch
One of the most underestimated factors is behavioral change.
Before launch, teams imagine users checking dashboards occasionally.
After launch, successful portals often experience:
- Increased engagement
- More exploratory usage
- Repeated drill-downs
- AI-driven queries (where applicable)
Good analytics naturally create more usage which in turn drives more compute.
A cost model that assumes static behavior quickly becomes outdated.
Why Pilots Underestimate Ongoing Cost
Many teams rely on pilot data to estimate production costs. This is risky.
Pilots typically involve:
- A small, motivated audience
- Artificially limited access
- Lower report variety
- Short usage windows
Real-world deployments introduce:
- Diverse user profiles
- Different time zones
- Inconsistent usage patterns
- Unplanned growth
The result is that production load is rarely a linear extension of pilot load.
Idle Time Is Where Money Is Lost
Another cost driver that is often missed is idle capacity time.
External analytics portals tend to have usage peaks during:
- Working hours
- Specific days
- Certain events (monthly reviews, quarter close, etc.)
Outside those periods, capacity often sits unused.
If capacity is always on, organizations pay for compute even when no one is logged in.
This is one of the biggest sources of "unexpected" spend and one of the easiest to optimize if addressed deliberately.
The Difference Between Predictable and Unpredictable Cost
Embedded analytics costs feel expensive when they are unpredictable.
They feel reasonable when:
- Peaks are understood
- Growth paths are visible
- Idle time is managed
- Scaling decisions are intentional
Teams that struggle with cost are rarely "using analytics too much." They are usually flying blind on usage patterns.
Understanding when and how analytics are consumed makes cost a variable you can control, not a surprise you react to.
Why Cost Discussions Should Happen at the Architecture Level
Cost optimization is often treated as an infrastructure concern. In reality, it starts much earlier.
Architectural decisions that affect cost include:
- Whether analytics are served through a portal or direct embedding
- How access is centralized
- Whether multiple tenants or clients share capacity
- How reports are reused vs duplicated
A good architecture absorbs growth gracefully. A weak one makes growth expensive.
Embedded Costs and the Illusion of "Cheap Prototypes"
It is common for teams to say: "The prototype is cheap – production will be similar."
In practice, prototypes hide cost drivers because:
- They lack real concurrency
- They do not reflect real data volumes
- They do not reflect real-world usage diversity
Production environments introduce variability and variability is expensive if not designed for.
This is why embedded analytics often feels cheap until it suddenly isn't.
What Sustainable Cost Models Get Right
The most successful embedded analytics teams share a few habits:
- They design for peaks, not averages
- They monitor usage continuously, not quarterly
- They invest in report performance early
- They treat idle time as waste to eliminate
- They expect growth and design for it
Most importantly, they resist the urge to oversimplify cost estimation.
From "How Much Does It Cost?" to "What Drives Cost?"
The most useful question is not: "How much will embedded analytics cost?"
It is: "What will drive embedded analytics cost in our case?"
Once that question is answered, optimization becomes practical:
- You know which reports need tuning
- You know when scaling is justified
- You know when growth is healthy vs inefficient
Cost becomes a management problem not a mystery.
Final Thoughts
Embedded analytics does not become expensive because too many people use it.
It becomes expensive when cost drivers are misunderstood, hidden, or ignored.
Organizations that succeed long term:
- Accept that usage patterns evolve
- Design for real-world behavior
- Treat cost as part of product thinking, not just billing
When cost is aligned with value delivery, embedded analytics stops being something to fear and becomes something you can scale with confidence.
👉 Book a demo today to see how PowerBI Portal helps you get the most out of Power BI capacities.

Share this post: