
Power BI Embedded: How the PowerBI Portal Optimizes Capacity Costs
One of the biggest advantages of Power BI Embedded is its flexible cost model. Unlike Power BI Pro or Premium, which typically require per-user or fixed monthly licenses, Embedded works on a capacity-based system: you pay for the compute power you need, when you need it, and you can turn it off when you don't. For many organizations, this sounds ideal — but the real cost of Embedded is rarely what teams expect when they first build their spreadsheets. This guide breaks down what actually drives Embedded costs at scale, and how the PowerBI Portal keeps them under control.
The Most Common Mistake: Treating Embedded Like Per-User BI
A surprising number of Embedded cost models start with an internal-BI mindset: how many users will we have, how many reports will each access, what's the equivalent per-user license cost? This is understandable but wrong. Embedded analytics does not behave like per-user licensing — costs are not driven by how many people have access, but by how the system is used under load. Treating Embedded as "Power BI Pro, but for externals" almost always leads to incorrect estimates.
Why user count is a poor cost predictor
Consider two scenarios. Scenario A: 1,000 registered users who log in a few times a month. Scenario B: 80 users who access dashboards constantly during business hours. From a capacity perspective, Scenario B is often more expensive. What matters is not how many people can access reports, but how many interact with them at the same time, and how demanding those interactions are. This is why teams that model costs purely on headcount get surprised after go-live.
What Actually Drives Power BI Embedded Costs
Many organizations assume costs are limited to the price of the capacity SKU (A1, A2, A3…). In reality, the SKU is only the starting point. The factors that actually shape spend in production are:
1. Concurrency, not total users
Concurrency is the single biggest driver of cost. How many users are active at the same time? When do peaks occur? Are users mostly reading, interacting, or refreshing frequently? Ten users hitting the same report simultaneously can generate more load than a hundred spread across a day. Most early estimates assume "average usage", but real systems are shaped by peaks.
2. Report complexity has a hidden price
Not all reports are equal. Cost is influenced by the number of visuals per page, complex DAX measures, large datasets or high-cardinality columns, and multiple slicers triggering recalculations. Two portals with identical user numbers can have dramatically different costs depending on how reports are designed — which is why cost optimization is as much about report engineering as infrastructure.
3. Data size and refresh frequency
Large datasets and near-real-time models require more resources, contributing heavily to operational expense. Every report render executes dataset queries and renders visuals, so high-frequency access significantly increases consumption.
4. Capacity scaling is not automatic
Power BI Embedded capacity does not scale automatically by default. Moving from an A1 to an A2 or A3 can double or triple monthly costs almost instantly. Concurrency peaks (for example, during morning business reviews) often trigger the need for higher, more expensive SKUs.
5. Usage patterns change after launch
One of the most underestimated factors is behavioural change. Before launch, teams imagine occasional dashboard checks. After launch, successful portals see increased engagement, more exploratory usage, repeated drill-downs, and AI-driven queries. Good analytics naturally create more usage, which drives more compute — so a cost model that assumes static behaviour quickly becomes outdated.
Capacity SKU Tiers (A-Series)
| SKU | Virtual cores | Backend RAM (GB) | Typical use case |
| A1 | 1 | 3 | Development and light testing |
| A2 | 2 | 5 | Small production environments |
| A3 | 4 | 10 | Medium production with interactive users |
| A4 | 8 | 25 | High-concurrency enterprise portals |
Idle Time Is Where Money Is Lost
External analytics portals tend to have usage peaks during working hours, on specific days, or around certain events (monthly reviews, quarter close). Outside those periods, capacity often sits unused. If capacity is always on, you pay for compute even when no one is logged in. This is one of the biggest sources of "unexpected" spend — and one of the easiest to optimize when addressed deliberately.
How to Control Embedded Costs Without Losing Performance
Measure before you scale
Cost control starts with visibility. Use Azure Monitor and the Power BI Capacity Metrics app to understand which reports consume the most resources and when peak usage occurs. Scale based on facts, not assumptions.
Optimize reports and data models
Poorly designed reports are the biggest driver of unnecessary capacity usage. Remove unused columns and tables, simplify complex DAX, and reduce the number of visuals per page.
Use intelligent automation
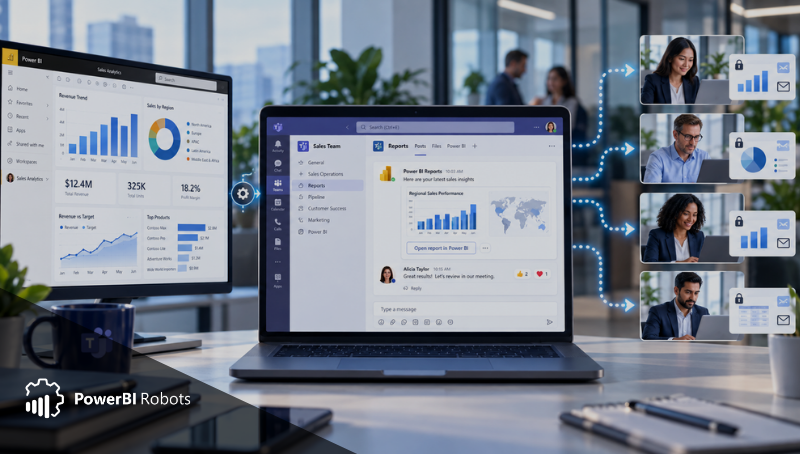
Users often don't need real-time interactivity for every report. Automating delivery with PowerBI Robots — generating snapshots instead of live sessions — shifts load away from expensive live capacity. For audiences that only need basic data, distributing reports by email or shared drives can bypass the cost of concurrent embedded sessions entirely.
Apply auto-scaling strategically
Auto-scaling lets capacity increase only when demand requires it, avoiding over-provisioning while keeping performance stable during peaks.
How PowerBI Portal Simplifies Cost Optimization
Managing capacity directly in Azure is tricky: knowing when to start or pause it, balancing peak performance against downtime overpayment, and managing multiple client environments. Left unmanaged, organizations end up paying for idle capacity or hitting performance bottlenecks. PowerBI Portal is designed to solve exactly this, automating and optimizing usage instead of requiring manual Azure management:
- Auto-scaling and on-demand activation: capacity starts when reports are accessed and pauses when no one is using them.
- Multi-client management: one central platform allocates capacity intelligently across clients or departments.
- Usage-based billing alignment: costs scale with actual use, so you can serve many users without runaway license expenses.
- Elimination of per-user licenses: external stakeholders don't need Pro or Premium accounts.
A Practical Example
Imagine a consultancy managing analytics for 50 clients. Not all check their dashboards daily — some log in only a few times a month. Paying for Pro licenses for every user, or a fixed Premium capacity, would cost far more than necessary. With Embedded through PowerBI Portal, you only pay for capacity used when clients access their dashboards. Over a year, this can mean thousands of dollars in savings, while still delivering a seamless, branded, secure analytics experience.
Beyond Cost Savings: Added Value
Cost optimization is only part of the story. PowerBI Portal also provides white-label branding so clients see your identity rather than Microsoft's, secure role-based access control with authentication integration, multi-tenant support to onboard dozens of clients from a single admin view, and no-code deployment that avoids complex developer work. The result: lower costs, faster delivery, and higher margins for consultancies offering Analytics-as-a-Service.
From "How Much Does It Cost?" to "What Drives Cost?"
Embedded analytics doesn't become expensive because too many people use it — it becomes expensive when cost drivers are misunderstood, hidden, or ignored. The most useful question isn't "how much will it cost?" but "what will drive cost in our case?". Once you can answer that, optimization becomes practical: you know which reports need tuning, when scaling is justified, and when growth is healthy versus inefficient. The teams that succeed design for peaks rather than averages, monitor usage continuously, invest in report performance early, treat idle time as waste, and expect growth. Paired with a portal that manages capacity intelligently, Embedded stops being something to fear and becomes something you can scale with confidence.
Final Thoughts
Power BI Embedded is already one of the most flexible and cost-effective ways to deliver analytics at scale. But without the right tools, managing capacity can quickly become a drain on both resources and budget.
With the PowerBI Portal, organizations can unlock the full benefits of Embedded while ensuring capacity costs stay optimized and under control.
👉 Book a demo today to see how PowerBI Portal helps you deliver secure, branded analytics — while keeping your Power BI costs lean and predictable.
Share this post: